I trust a reports dashboard less when it knows too much. The safest version is narrower: it tells me where traffic came from, what landed, what looks broken, and what needs a human check without becoming a warehouse for everything the browser happened to whisper.
When I design a reporting panel like this, I start with a few blunt questions. What do I actually need to see every morning? Which source details help me debug, and which ones just add privacy risk? How do I keep the data useful when referrers are missing, truncated, or blocked? And how do I stop a simple dashboard from turning into a tiny surveillance system with charts?
Those are not theoretical questions. The browser’s Referer header is optional and inconsistent by design, not a promise of perfect attribution. The OWASP Logging Cheat Sheet also makes the right point: logs and report stores are security-sensitive data, not a junk drawer. If I am going to build a dashboard that survives real use, I need to treat it like an operational system, not a vanity panel.
In this article, I will show the parts that matter on day one: the data model, normalization rules, validation boundaries, aggregation strategy, privacy controls, and a dashboard layout that helps you spot source problems without collecting unnecessary detail. If you want the surrounding site context, the Reports & Tracking page covers the broader workflow, the RedKernel Referer Tracker page focuses on the tracker itself, and the Support page is where a broken report should end up when the numbers stop agreeing with reality.
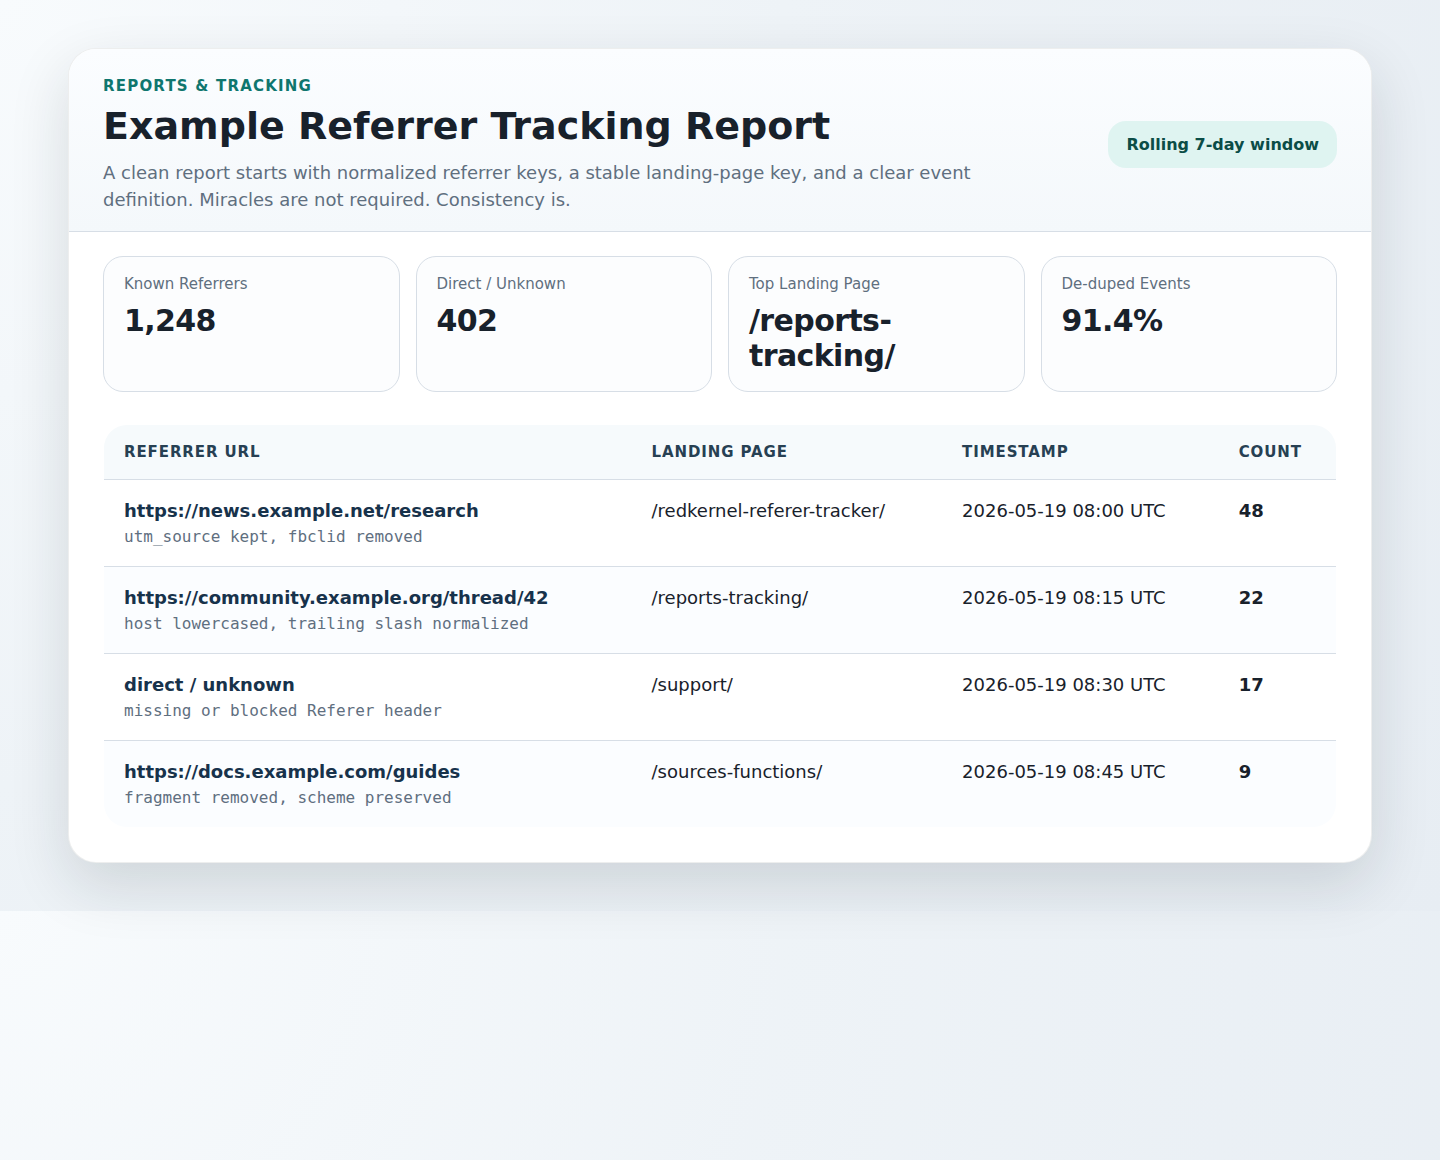
What reports & tracking should do, and what it should not do
I keep a simple rule in mind: a reporting system should answer a question, not collect a biography. For a developer site, a safe dashboard should help me do four things well.
- See which sources are sending traffic to which pages.
- Spot broken routes, missing referrers, or odd spikes quickly.
- Compare counts across time without storing every raw detail forever.
- Give me enough context to fix a problem, then get out of the way.
It should not do these things.
- Keep every full URL, token, or query string by default.
- Render raw input directly into the admin screen and hope nobody pastes junk into it.
- Track personal data just because the database has room.
- Change definitions every time someone asks for a new chart.
That separation matters because a dashboard is not only a viewer. It is also a storage policy, a retention policy, and a trust boundary. If the panel is safe, the store underneath it usually becomes easier to defend. If the panel is sloppy, the database follows suit.
The practical benefit is straightforward. A narrow reporting model makes it easier to answer questions like, “Which page is attracting unknown traffic?” or “Did a change in redirects wipe out a source bucket?” without creating a pile of unnecessary records that nobody wants to own later.
| Goal | Useful | Not useful |
|---|---|---|
| Debugging | Source bucket, landing page, parse status, retention window | Permanent raw headers, sensitive parameters, full debug traces forever |
| Basic analytics | Top referrers, top pages, direct/unknown counts, time windows | Microscopic request logs for every visitor |
| Privacy-first reporting | Grouped counts and normalized keys | Identity-rich records with no deletion plan |
Define the data model before you draw the graph
I do not start with charts. I start with fields. If the model is wrong, the dashboard will politely visualize a mistake.
For a safe referrer and source dashboard, I prefer a split between raw input, normalized output, and report-friendly aggregates. Raw input is the temporary evidence. Normalized output is what I trust enough to store. Aggregate rows are what I trust enough to show widely.
| Field | Collect? | Why | Store safely as |
|---|---|---|---|
| Event timestamp | Yes | Needed for trend windows and incident review | UTC timestamp, then bucket by day or hour |
| Landing page path | Yes | Shows which page received the traffic | Canonical path or route |
| Referrer host | Yes | Main source grouping key | Lowercased parsed host |
| Referrer path | Sometimes | Useful for debugging and source detail | Only if the report actually needs it |
| Query parameters | Only allow-listed ones | Campaign or source tags can be useful, but most are noise | Short JSON map of approved keys |
| IP address | Usually no | Privacy risk rises fast and the value often drops fast too | Avoid, truncate, or replace with a short-lived hash if the use case truly demands it |
| Full user agent | Rarely | Useful for diagnostics, but noisy for normal reports | Derived family labels such as browser, bot, or unknown |
| Raw header text | Maybe, briefly | Helpful during troubleshooting | Short retention only, not for everyday reporting |
If I were building this for a team, I would make one more rule explicit: every field needs an owner. If nobody can say why a field exists, it usually should not survive the next release.
A practical source log can stay small and still be useful. I only need enough structure to answer three questions: what was observed, what was normalized, and what should the report count. The rest is usually decorative risk.
Normalization workflow: make the same source count as the same source
Normalization is where the dashboard stops being a bucket of strings and becomes a report. Without it, the same source can appear in half a dozen forms and split the counts until the chart lies by omission.
My normalization workflow usually follows the same order.
- Trim whitespace. Leading and trailing spaces should not create new buckets.
- Reject obviously broken inputs early. If parsing fails, do not try to rescue the value with guesswork.
- Enforce length limits. Very long headers and URLs usually deserve rejection or a debug-only bucket.
- Parse the URL safely. Treat the browser input as untrusted, because it is.
- Lowercase the host. Hostnames should not split because of case.
- Remove fragments. They are usually irrelevant to server-side source tracking.
- Normalize the path. Decide once whether trailing slashes, index pages, and duplicate separators collapse to one canonical form.
- Allow-list only the parameters you truly need. Every extra parameter is another privacy and maintenance decision.
This is also where the Referrer-Policy header belongs in the conversation. If the browser only sends a reduced source signal, my dashboard should treat that as normal and label it clearly instead of pretending the missing detail is a software bug.
One useful habit is to separate the raw value from the normalized key in your schema. Raw input is for short-lived diagnostics. Normalized keys are for grouping. If those two things get mixed together, reporting becomes harder to explain and easier to break.
I also try to keep an eye on source consistency. A report should not show Example.com, example.com, and example.com/ as three separate major sources unless the distinction is truly useful. Usually it is not. Usually it is just a way to make an under-specified report look busier than it really is.
If you need reusable helper code for the parsing and path cleanup stage, the Sources/Functions… page is the natural place to keep the supporting utility set visible and organized. I like that separation because it keeps the dashboard logic focused on reporting rather than becoming a junk drawer of small fixes.
Validation rules: allowlists, safe parsing, and clear rejections
I do not trust “best effort” parsing for report inputs. If the system accepts malformed values and silently fixes them, the dashboard starts producing clean-looking nonsense. That is worse than an obvious error.
Safe validation usually means four things.
- Allow only the schemes you actually support. For source URLs, that usually means
httpandhttps. - Reject malformed hosts and paths. If parsing breaks, route the item into a debug bucket instead of inventing a new source.
- Block obvious log pollution. Control characters, line breaks, and unsafe separators should not reach storage or display.
- Keep the rejection reason. “Invalid URL,” “blank header,” and “self-referral” are useful quality signals.
The reason I keep the rejection reason is simple: a dashboard without a reason code becomes a detective story every time counts drift. A dashboard with reason codes becomes an operations tool.
The OWASP XSS Prevention Cheat Sheet belongs here as well, because the report view itself must treat every stored string as hostile until it is escaped for the final output context. What comes in untrusted should stay untrusted all the way to the screen.
I also separate validation of the referrer from validation of the landing page. The landing page is usually under my control and can be matched against known routes. The referrer comes from outside and should be treated more skeptically. That difference sounds obvious until someone tries to use one rule for both and ends up grouping a broken URL as if it were a valid source.
Aggregation approach: counts, windows, and the right amount of detail
If I want the dashboard to stay fast and private, I aggregate early. Raw event rows are fine for short windows and troubleshooting. Long-term reporting usually works better with grouped counts.
The key is to decide what the chart should summarize. I usually keep three windows in mind.
| Window | Best for | Why it helps |
|---|---|---|
| Hourly | Fresh spikes, launch-day checks, incident review | Shows a sudden change before it becomes a trend |
| Daily | Normal operational review | Good balance of signal and simplicity |
| Weekly | Pattern review and lighter trends | Smooths noise and reduces the urge to overreact |
For the source side, I group by normalized referrer host first, then by path when the path actually tells me something useful. For the page side, I group by canonical landing path. If I need more detail, I add it deliberately, not automatically.
Counts are usually enough for day one. A count by itself is not dramatic, but it is honest. Once I trust the count, I can add a percentage share, a delta from the previous window, and a small trend arrow. I do not add them first, because decoration without a stable count just makes a weak report look confident.
A useful pattern is to keep two aggregates:
- Event aggregates for operational review and debugging.
- Daily rollups for long-term trends and lightweight historical comparisons.
That split gives me flexibility. I can expire detailed rows sooner and retain rollups longer. I can also compare source quality without exposing granular rows to every person who opens the panel.
One more practical rule: if a metric is unstable, label it unstable. Missing headers, privacy settings, and redirects all affect source reporting. The chart should not pretend otherwise.
Privacy-first practices: minimize, shorten, anonymize, and limit access
This is the part that keeps the dashboard from turning into a liability. I want the smallest data set that still answers the question. That means I think about the lifecycle before I think about the chart color.
My privacy-first checklist usually looks like this.
- Minimize collection. Store only the fields that support reporting or debugging.
- Set a retention window. Detailed data should expire on purpose, not by accident.
- Prefer aggregation over raw storage. Long-term trends do not need every event row.
- Drop sensitive parameters. Tokens, emails, passwords, and reset links never belong in a source dashboard.
- Use short-lived debug access. If raw data must exist, keep it tightly scoped and short-lived.
- Restrict who can view exports. A CSV download is still a data release.
- Review screenshots and shares. People leak report details when they share “just one quick image.”
I also like to define a direct/unknown bucket up front. That bucket covers bookmarks, blocked headers, private browsing behavior, and anything else the browser refuses to explain. It is better to label uncertainty than to pretend certainty is present when it is not.
If the team needs a policy reference for privacy behavior in browsers and source suppression, the MDN Referer reference is helpful because it reminds you that the browser decides how much source detail is exposed. I build the dashboard to accept that limit rather than fight it.
Access control matters too. A developer dashboard can still be sensitive if it reveals referral patterns, internal page names, campaign tags, or problem URLs. I keep the default audience small and the export path even smaller. If a report cannot be shown safely to the entire team, it should not be a casual public-facing panel.
When I am reviewing a system that has started to sprawl, I ask one stubborn question: if this table leaked tomorrow, what would the damage be? If the answer makes me uncomfortable, I trim the table.
Dashboard design: what I would show on day one
Day one dashboards should be boring in the best sense. I want the smallest set of panels that helps me answer the first operational questions quickly.
For a safe reports-and-tracking view, I would start with five panels.
| Panel | Question answered | Action it supports |
|---|---|---|
| Top referrers | Which external sources are sending visits? | Check partner links, campaigns, and obvious junk |
| Top landing pages | Which pages are receiving the traffic? | See whether the right content is being found |
| Direct/unknown bucket | How much traffic lacks a usable referrer? | Spot blocked headers or implementation gaps |
| Self-referrals and internal noise | Is the site feeding itself? | Find redirect mistakes and internal host leaks |
| Validation errors | What failed to parse or normalize? | Fix bad inputs before they distort the report |
I do not need a dozen charts to start. I need enough structure to see source quality, traffic shape, and failure modes. If the dashboard answers those questions in one screen, it is doing its job.
Visually, I prefer one clear table, one compact time series, and one exception block. Too many widgets make the page look active while making the reader work harder. A clean reports page should feel like a control room, not a slot machine.
There is one place where a third-party reference can be useful if the team later wants to turn these counts into a broader internal app. A neutral starting point is figure out where AI fits before adding automated summaries or anomaly detection to a reporting workflow. I would only bring that in after the basic dashboard is stable, because a bad report with a machine-learning badge is still a bad report.
For the site itself, I would keep the related links nearby. The Home page should make the main sections easy to reach, and the Blog index should surface the article alongside the rest of the operational guidance.
Troubleshooting: why tracking breaks and how I diagnose it
Most broken dashboards fail in a small number of boring ways. That is useful, because boring failures are easier to fix than mysterious ones.
Encoding mismatches
If URLs are encoded differently at capture, storage, and display time, the same source can split into several variants. I check whether decoding happens too early or too late, and whether the normalized key is being double-encoded before it reaches the report view.
The fix is usually simple: store one normalized representation, then escape again only for the final display context. The report table should never guess which version of a string is the real one.
Missing headers
When a referrer is missing, I do not assume the tracker failed. I first check whether the browser or privacy layer suppressed it, whether a redirect stripped it, or whether the user simply arrived directly. The Referrer-Policy documentation is useful here because it reminds me that source information can be reduced before my code ever sees it.
My report should reflect that uncertainty. A direct/unknown bucket is not an error bucket. It is a reality bucket.
Blocked referrers
Some browsers, privacy tools, and intermediate systems reduce or block source detail. I check whether an unexpected spike in direct traffic lines up with a site change, a redirect change, or a browser behavior change. If the answer is “maybe all three,” I still keep the direct bucket visible and avoid inventing certainty.
Bad parsing and malformed inputs
If the dashboard starts losing rows, I inspect validation logs first. A malformed source should be rejected cleanly, not warped into a fake hostname that looks tidy enough to mislead the reader. That is where stable parse errors and rejection reasons earn their keep.
Internal host contamination
If my own site appears as a top referrer, I check the host allowlist, redirect chains, canonical URLs, and any internal navigation behavior that was accidentally treated like a new source. Self-referrals should be visible in a controlled bucket, not promoted to the top of the report by accident.
When troubleshooting gets messy, I send the reader back to the Support page rather than pretending a dashboard alone can explain every anomaly. That keeps the fix path honest and keeps the article grounded in a real operational workflow.
Security checklist for report views and exports
A reporting screen is part of the attack surface. If I can render it, I can break it unless I respect the output context. I use the same discipline I would use anywhere else I display untrusted data.
- Escape every field on output. Raw report strings should never be dropped directly into HTML.
- Validate before storage. Do not let malformed inputs become permanent data.
- Limit field length. Shorter fields reduce attack surface and storage noise.
- Protect CSV and export views. Spreadsheet exports can carry formula injection risks if values are not handled carefully.
- Keep admin access narrow. Only the people who need the data should reach it.
- Separate debug from normal reporting. Raw strings belong in narrow troubleshooting paths, not public dashboards.
- Log your own validation failures. Security and data-quality failures should be visible to operators, not hidden in silence.
The OWASP guidance on logging and XSS prevention is worth keeping nearby because report views are just another place where untrusted input can become dangerous output. A dashboard is only as safe as the last render step.
I also avoid burying the important rules inside helper functions nobody can explain. A small utility can be useful, but I want the validation and escaping policy to stay obvious enough that another developer can audit it without reading three layers of framework magic.
What I would ship first
If I were building this dashboard from scratch, I would start with the smallest version that still answers the main operational questions.
- Capture only the fields I can justify.
- Normalize source and landing page keys once.
- Store a direct/unknown bucket from the start.
- Aggregate daily counts for top referrers and top pages.
- Render one clean table, one small trend line, and one exception panel.
- Set a retention policy for raw data before I open the dashboard to more than one person.
That is usually enough to make the report useful without making it fragile. If the panel works at that size, I can add detail later. If it does not work at that size, more fields will not save it.
The web does not owe me perfect referrer data, and my dashboard does not owe me every available byte. What it owes me is judgment. Show the source. Show the landing page. Show the unknowns. Protect the rest.
That is the minimum safe setup I trust. Anything louder has to earn its way in.